I've recently had a number of friends migrate over to Alpine linux, and a couple of them have also become package maintainers! It's been really fun to answer questions and help troubleshoot some really unique installations. I've also recently extended my homelab with an LXD cluster, so I've got some computing resources to spare. Because of that I've set back up my MrBuildit APKBUILD CI/CD, and opened it up to our little tilde community "The Casa". There's a lot that has gone into the project, but our end goal is to have our own package repository for all of our personal software and silly ideas.
To date we're working with three CICD builders all running gitlab-runner and using custom docker containers to build out Alpine packages. Two are Dell 7020ms setup as an LXD cluster, and the other is a Pine64 RockPro board. That gives us the following to work with.
- Dell 7020m
- i5-4590T
- 12G RAM
- 240Gb SSD
- Pine64 RockPro64
- Hexacore Rockchip RK3339
- 4Gb RAM (really 3.75Gb)
- 128Gb SD Card
While not the most powerful stack, it's enough to run through all the x86 and arm types that we want to support. And is extensible enough to later on handle local repos and other QoL infra to help making maintaining existing official packages and casa packages easier. All of that sounds exciting and fun, except for the fact that the Pine64 board is less then reliable, and easily overwhelmed during larger CI/CD jobs. For the past couple of weeks we've been fighting on and off issues caused by the board itself. Unfortunately the hwclock on it is less than reliable, it can be manually synced, but will random jump into the future. NTP doesn't seem to fix the issue particularly well, but forcing it to sync with hwlcokc --systohc is OK enough, so I wrote a poorman's NTP service just to keep the system roughly in sync with real time. But today, well today it broke in such a strange way that it warrants this entire blog post.
First off a note, the PNTP server was using UTC time, not EST. Zabbix reports intermittent loss of communication at 10:33:24am, or 15:33:24pm UTC.
We started a new CI/CD build of ghostwriter at 10:29am
2022-02-11 10:29:46 mio wsinatra: no future timestamps warnings anymore, make is proceeding, fingers crossed
By 10:40 we were pretty certain something was up.
2022-02-11 10:40:06 mio mmm, both jobs are stuck on their same respective steps for the past 3 minutes, hope it's not a bad sign
And we knew it was dead when the job timed out, but lets be honest we spent the rest of the day lamenting the broken CI/CD runner.
2022-02-11 15:04:28 mio wsinatra: bad news, the job timed out https://gitlab.com/Durrendal/WS-Alpine-Packages/-/jobs/2083682680
I stopped getting alerts from Zabbix after the jobs became stuck, but prior to them dying I got the following series of messages.
Problem started at 10:33:24 on 2022.02.11
Problem name: Zabbix agent is not available (for 3m)
Host: Axiomatic (LXC)
Severity: Average
Operational data: not available (0)
Original problem ID: 170161

Problem started at 10:39:10 on 2022.02.11
Problem name: mmcblk1: Disk read/write request responses are too high (read > 20 ms for 15m or write > 20 ms for 15m)
Host: Axiomatic (LXC)
Severity: Warning
Operational data: 51.76 ms, 1634.38 ms
Original problem ID: 170172
And then nothing else for the rest of the day, the runners were offline after that. When I got home I was able to ping the server, but I couldn't SSH into it and it wasn't reaching out to the PNTP server. Off to poke Zabbix to see if there's anything we can glean.
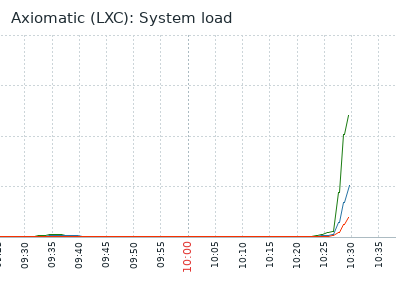
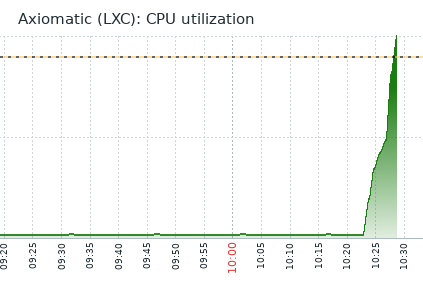
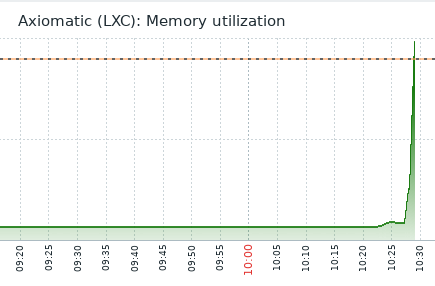
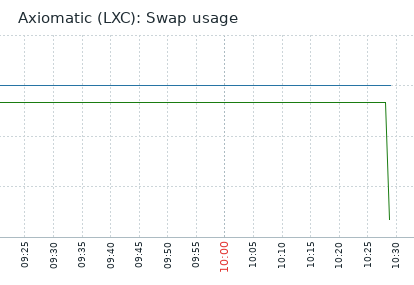
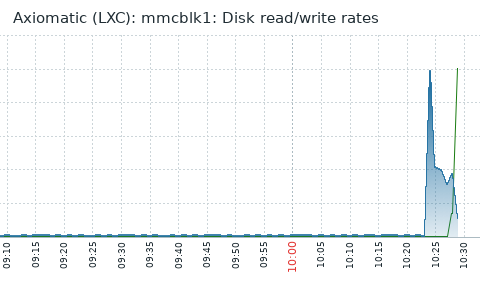
Zabbix makes it immediately clear that when the builder died on us it was pinned hard. CPU, RAM, Swap, and Disc were all under heavy utilization and then everything just cuts off. Can't get any info in if the agent on the system can't communicate out.
Resetting the board brought it back online, and it looks like there was some logging information intact. Our CI/CD pipe runs inside of Docker triggered by Gitlab-runner, so /var/log/docker.log is my first target.
Time is broken wildly on the system, but this is roughly the right time ish. The symptoms match the errors at least.
time="2022-02-11T18:33:14.253668125-05:00" level=warning msg="grpc: addrConn.createTransport failed to connect to {unix:///var/run/docker/containerd/containerd.sock 0 }. Err :connection error: desc = \"transport: Error while dialing dial unix:///var/run/docker/containerd/containerd.sock: timeout\". Reconnecting..." module=grpc
These connection errors continue until I restarted the RockPro and I get this nice time change.
time="2022-02-01T02:27:01.214619825-05:00" level=info msg="Starting up"
Seriously, time is broken so severely it's not even funny. Anyways, docker communicates over a local unix socket, Zabbix says R/W errors, so chances are it couldn't r/w from the socket. Checking /var/log/message we find this fun little line, there's nothing else really in messages other than random dates all over the place. But not even syslog can keep up.
2022-02-11 18:33:24 err syslog-ng[1900]: I/O error occurred while reading; fd='14', error='Broken pipe (32)'
To /var/log/kern.log it is! We must've broken something horribly for syslog to die. And there we go, oom'd to death, that makes sense. Disc failure would have brought the server down completely, or just slowed the process.
2022-02-11 15:29:02 warning kernel: moc invoked oom-killer: gfp_mask=0x1100cca(GFP_HIGHUSER_MOVABLE), order=0, oom_score_adj=0
So the SBC has 3.78GB of RAM, and a 1.5GB zram swap. Not a lot to work with here. During our build process, at the point where the kernel tried to OOM it and kinda just died we used..
2022-02-11 15:29:03 warning kernel: lowmem_reserve[]: 0 0 0 0
2022-02-11 15:29:03 warning kernel: DMA: 1502*4kB (UMEH) 742*8kB (UMEH) 441*16kB (UMEH) 219*32kB (UEH) 41*64kB (UEH) 0*128kB 0*256kB 0*512kB 0*1024kB 0*2048kB 0*4096kB = 28632kB
2022-02-11 15:29:03 warning kernel: 2046 total pagecache pages
2022-02-11 15:29:03 warning kernel: 7 pages in swap cache
2022-02-11 15:29:03 warning kernel: Swap cache stats: add 1799196, delete 1798216, find 415/610392
2022-02-11 15:29:03 warning kernel: Free swap = 0kB
2022-02-11 15:29:03 warning kernel: Total swap = 1572860kB
2022-02-11 15:29:03 warning kernel: 1015296 pages RAM
2022-02-11 15:29:03 warning kernel: 0 pages HighMem/MovableOnly
2022-02-11 15:29:03 warning kernel: 23487 pages reserved
2022-02-11 15:29:03 warning kernel: 4096 pages cma reserved
Yeah, everything. Every last bit of ram and swap available. And the nice verbose memory page dump gives us a clue as to why.
2022-02-11 15:29:03 info kernel: Tasks state (memory values in pages):
2022-02-11 15:29:03 info kernel: [pid] uid tgid total_vm rss pgtables_bytes swapents oom_score_adj name
2022-02-11 15:29:03 info kernel: [1423] 0 1423 3730 40 57344 67 0 udevd
2022-02-11 15:29:03 info kernel: [1899] 0 1899 1699 1 49152 100 0 syslog-ng
2022-02-11 15:29:03 info kernel: [1900] 0 1900 2668 74 57344 169 0 syslog-ng
2022-02-11 15:29:03 info kernel: [2007] 0 2007 1431 0 49152 16 0 syslogd
2022-02-11 15:29:03 info kernel: [2034] 0 2034 211 2 36864 16 0 acpid
2022-02-11 15:29:03 info kernel: [2143] 104 2143 1886 35 49152 86 0 chronyd
2022-02-11 15:29:03 info kernel: [2171] 0 2171 417 13 49152 2 0 crond
2022-02-11 15:29:03 info kernel: [2203] 100 2203 395 2 36864 22 0 dbus-daemon
2022-02-11 15:29:03 info kernel: [2232] 0 2232 264 1 45056 18 0 supervise-daemo
2022-02-11 15:29:03 info kernel: [2233] 0 2233 193159 3500 290816 5007 0 dockerd
2022-02-11 15:29:03 info kernel: [2259] 0 2259 264 1 40960 18 0 supervise-daemo
2022-02-11 15:29:03 info kernel: [2260] 0 2260 189991 2379 229376 3218 0 gitlab-runner
2022-02-11 15:29:03 info kernel: [2287] 0 2287 3958 38 69632 139 0 sensord
2022-02-11 15:29:03 info kernel: [2330] 0 2330 1080 33 40960 89 -1000 sshd
2022-02-11 15:29:03 info kernel: [2429] 0 2429 264 1 36864 18 0 supervise-daemo
2022-02-11 15:29:03 info kernel: [2430] 102 2430 182299 2021 159744 644 0 zabbix_agent2
2022-02-11 15:29:03 info kernel: [2542] 0 2542 414 2 40960 10 0 getty
2022-02-11 15:29:03 info kernel: [2543] 0 2543 414 2 40960 11 0 getty
2022-02-11 15:29:03 info kernel: [2544] 0 2544 414 2 36864 10 0 getty
2022-02-11 15:29:03 info kernel: [2545] 0 2545 414 2 40960 11 0 getty
2022-02-11 15:29:03 info kernel: [2546] 0 2546 414 2 45056 11 0 getty
2022-02-11 15:29:03 info kernel: [2547] 0 2547 414 2 40960 11 0 getty
2022-02-11 15:29:03 info kernel: [2560] 0 2560 186626 2555 208896 1659 0 containerd
2022-02-11 15:29:03 info kernel: [17843] 0 17843 178409 1163 114688 1 1 containerd-shim
2022-02-11 15:29:03 info kernel: [17872] 1000 17872 345 12 28672 10 0 sh
2022-02-11 15:29:03 info kernel: [17943] 1000 17943 363 13 28672 30 0 sh
2022-02-11 15:29:03 info kernel: [17965] 1000 17965 338 3 28672 15 0 buildit.sh
2022-02-11 15:29:03 info kernel: [18228] 0 18228 178473 1092 114688 0 1 containerd-shim
2022-02-11 15:29:03 info kernel: [18248] 1000 18248 436 13 40960 18 0 sh
2022-02-11 15:29:03 info kernel: [18283] 1000 18283 456 13 40960 40 0 sh
2022-02-11 15:29:03 info kernel: [18291] 1000 18291 424 5 49152 20 0 buildit.sh
2022-02-11 15:29:03 info kernel: [18355] 1000 18355 420 4 32768 99 0 abuild
2022-02-11 15:29:03 info kernel: [18496] 1000 18496 551 5 45056 143 0 abuild
2022-02-11 15:29:03 info kernel: [18933] 1000 18933 1261 654 36864 389 0 make
2022-02-11 15:29:03 info kernel: [18950] 1000 18950 428 0 28672 30 0 g++
2022-02-11 15:29:03 info kernel: [18951] 1000 18951 428 0 32768 31 0 g++
2022-02-11 15:29:03 info kernel: [18953] 1000 18953 20851 12374 188416 2896 0 cc1plus
2022-02-11 15:29:03 info kernel: [18954] 1000 18954 573 0 36864 97 0 as
2022-02-11 15:29:03 info kernel: [18955] 1000 18955 14866 5512 139264 3715 0 cc1plus
2022-02-11 15:29:03 info kernel: [18956] 1000 18956 573 0 32768 97 0 as
2022-02-11 15:29:03 info kernel: [18989] 1000 18989 1465 768 53248 435 0 make
2022-02-11 15:29:03 info kernel: [19006] 1000 19006 531 3 40960 36 0 g++
2022-02-11 15:29:03 info kernel: [19007] 1000 19007 531 1 36864 36 0 g++
2022-02-11 15:29:03 info kernel: [19009] 1000 19009 19812 6908 196608 4830 0 cc1plus
2022-02-11 15:29:03 info kernel: [19010] 1000 19010 18771 6054 184320 4778 0 cc1plus
2022-02-11 15:29:03 info kernel: [19011] 1000 19011 1043 0 49152 257 0 as
2022-02-11 15:29:03 info kernel: [19012] 1000 19012 1043 1 45056 257 0 as
2022-02-11 15:29:03 info kernel: [19013] 1000 19013 425 1 28672 28 0 gcc
2022-02-11 15:29:03 info kernel: [19028] 1000 19028 425 1 32768 28 0 gcc
2022-02-11 15:29:03 info kernel: [19043] 1000 19043 531 3 36864 36 0 gcc
2022-02-11 15:29:03 info kernel: [19048] 1000 19048 425 1 32768 29 0 gcc
2022-02-11 15:29:03 info kernel: [19055] 1000 19055 425 1 28672 29 0 gcc
2022-02-11 15:29:03 info kernel: [19061] 1000 19061 531 3 36864 36 0 gcc
2022-02-11 15:29:03 info kernel: [19063] 1000 19063 531 3 36864 35 0 gcc
2022-02-11 15:29:03 info kernel: [19072] 1000 19072 531 1 36864 36 0 g++
2022-02-11 15:29:03 info kernel: [19073] 1000 19073 531 1 40960 35 0 g++
2022-02-11 15:29:03 info kernel: [19074] 1000 19074 24768 11577 233472 4723 0 cc1plus
2022-02-11 15:29:03 info kernel: [19075] 1000 19075 531 3 36864 36 0 g++
2022-02-11 15:29:03 info kernel: [19076] 1000 19076 1043 1 45056 257 0 as
2022-02-11 15:29:03 info kernel: [19077] 1000 19077 531 2 36864 35 0 g++
2022-02-11 15:29:03 info kernel: [19078] 1000 19078 18768 5842 184320 4596 0 cc1plus
2022-02-11 15:29:03 info kernel: [19079] 1000 19079 531 3 36864 36 0 g++
2022-02-11 15:29:03 info kernel: [19080] 1000 19080 1043 1 45056 257 0 as
2022-02-11 15:29:03 info kernel: [19081] 1000 19081 18867 5880 184320 5109 0 cc1plus
2022-02-11 15:29:03 info kernel: [19082] 1000 19082 20919 10522 196608 2407 0 cc1plus
2022-02-11 15:29:03 info kernel: [19083] 1000 19083 531 3 36864 36 0 g++
2022-02-11 15:29:03 info kernel: [19084] 1000 19084 1043 1 53248 256 0 as
2022-02-11 15:29:03 info kernel: [19085] 1000 19085 22875 7951 204800 4980 0 cc1plus
2022-02-11 15:29:03 info kernel: [19086] 1000 19086 1043 1 49152 257 0 as
2022-02-11 15:29:03 info kernel: [19087] 1000 19087 531 1 36864 35 0 g++
2022-02-11 15:29:03 info kernel: [19088] 1000 19088 20903 7753 204800 4685 0 cc1plus
2022-02-11 15:29:03 info kernel: [19089] 1000 19089 1043 1 49152 256 0 as
... ~300 lines of duplicate gcc, g++, and cc1plus truncated for your sanity
2022-02-11 15:29:03 info kernel: [19715] 1000 19715 2070 1047 49152 0 0 moc
2022-02-11 15:29:03 info kernel: [19729] 1000 19729 390 5 32768 0 0 moc
At the time the SBC crashed we were running 2 CI jobs, the same apkbuild in an armv7 builder and an aarch64 builder. Lots of duplicate processes all clamboring for memory. It looks like the cc1plus build process uses up more ram than we're provisioned for, potentially if we're only running one build it might be fine, but running two it dies. And the kernel log confirms it for us.
2022-02-11 15:29:03 info kernel: oom-kill:constraint=CONSTRAINT_NONE,nodemask=(null),cpuset=4d053ebd467075db26e03b7fa0e43dac55b4a6d7621891d146dbd1bc62a6abbb,mems_allowed=0,global_oom,task_memcg=/docker/4d053ebd467075db26e03b7fa0e43dac55b4a6d7621891d146dbd1bc62a6abbb,task=cc1plus,pid=19168,uid=1000
2022-02-11 15:29:03 err kernel: Out of memory: Killed process 19168 (cc1plus) total-vm:94408kB, anon-rss:60424kB, file-rss:0kB, shmem-rss:0kB, UID:1000 pgtables:212kB oom_score_adj:0
2022-02-11 15:29:03 info kernel: oom_reaper: reaped process 19168 (cc1plus), now anon-rss:0kB, file-rss:0kB, shmem-rss:0kB
2022-02-11 15:30:03 warning kernel: containerd-shim invoked oom-killer: gfp_mask=0x1100cca(GFP_HIGHUSER_MOVABLE), order=0, oom_score_adj=1
2022-02-11 15:30:03 warning kernel: CPU: 3 PID: 18275 Comm: containerd-shim Not tainted 5.14.9 #3-postmarketos-rockchip
This is all still a little strange because we've been able to build the package on an armv7 chromebook with 2GB of ram just fine. The server idles at 166Mb when not running a CI/CD job. The syslogging seems to indicate issues with the build process, enough for me to pull back our CI/CD configuration to only run a single job at any given time and set resource limitations on our LXC containers. While it might be slower it's more appropriate for the astringent resources our current builders provide. If anyone knows of reliable ARM boards with an aarch64 cpu and either more RAM or expandable ram that don't cost ~$1000 I would love to know, having something with a little more room would have prevented this entire post.
That's all there really is to say for now, I just thought it would be fun to write about building packaging infrastructure, and the troubleshooting methods I'm using to dig in when we have problems. Cannot iterate how useful syslogging and Zabbix are when you run into problems!